Your web browser (Internet Explorer) is out of date. Some things will not look right and things might not work properly. Please download an up-to-date and free browser from here.
3:29pm, 24th December
Home > Maps & Radars > Lightning > Thunderstorm Risk
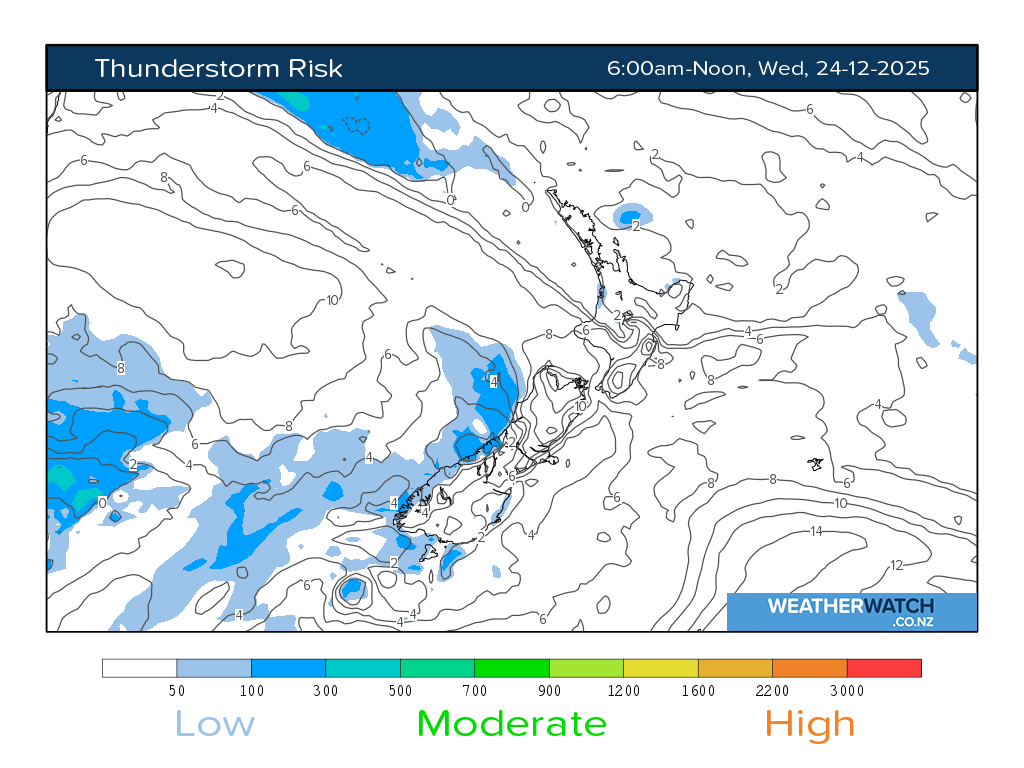
Thunderstorm Risk

Map shows: Convective Available Potential Energy (J/kg) and Surface Lifted Index (°K).
GFS model data provided by NOAA.
Navigation
© 2025 WeatherWatch Services Ltd


