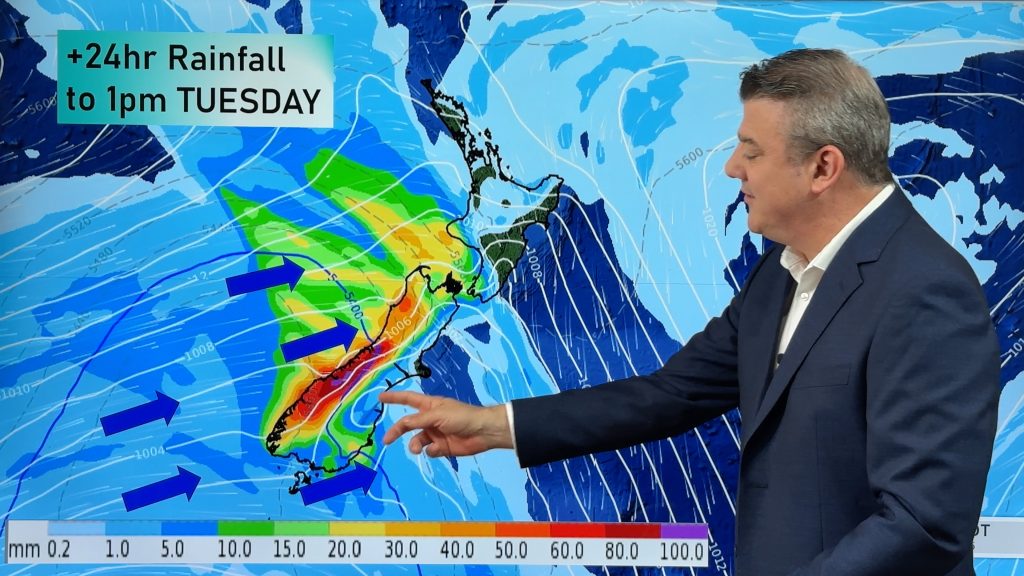
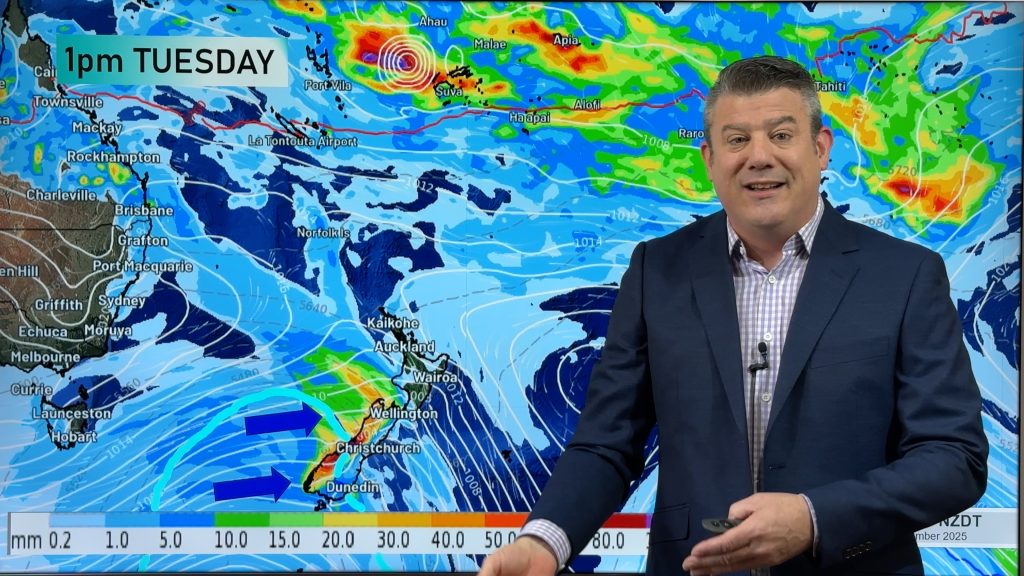
New Maps paint more 3D picture of Wednesday’s brief polar change (+4 Maps)
12/08/2019 8:25pm

> From the WeatherWatch archives
As forecasters that specialise in communicating the weather we always want to find maps that visually ‘pop’ – like these new ones from Majicweather.com.
These maps give a very clear picture of the Antarctic surge moving up New Zealand and how it behaves much like a swell, or wave, moving into a beach.
The cold polar winds ‘hit’ the South Island today and ‘roll’ up the country tonight and through Wednesday, pulling more and more to the east as it does so – caught up in the enormous low pressure belt that is not only dredging up this cold southerly – but also pulling it away from NZ as it tries to head north.
With sets ups like this one these maps do a great job at showing the cold air surging in – but look at the final map for the end of Wednesday and already that milder Aussie westerly airflow is rolling in to the very lower South Island, finally ending this several day event.
How to read these maps:
These great maps show the colder southerly quarter flow (blue) vs the warmer northerly quarter flows (orange). The brighter/whiter the colours get the stronger the winds are. The darker it is, the calmer it is.
6AM TUESDAY:
6PM TUESDAY:
6AM WEDNESDAY:
6PM WEDNESDAY:
– Our thanks by Majicweather.com for creating these great maps and reaching out to us.
– WeatherWatch.co.nz
Comments
Before you add a new comment, take note this story was published on 12 Aug 2019.


Add new comment