ClimateWatch: SEPTEMBER has some pattern to the chaos (+11 Maps & Video)
2/09/2024 2:31am

> From the WeatherWatch archives
Big and powerful storms continue to churn south of New Zealand and Australia over the month ahead and coupled with high pressure zones exiting Australia it means more windy westerlies will surge off and on from Tasmania to NZ. This also means western areas will see highest rainfall totals, especially the further south you are (ie, Westland).
Eastern areas will be in more of a rain shadow (Coastal Canterbury and Hawke’s Bay for example) – but recent wet weather means soil moisture levels across NZ are in a good position as we kick off the more official part of spring weather. The windy westerly weather may start to dry the east out more in the coming weeks though.
Temperatures look to remain above normal for NZ as we go into this month – but don’t let that fool you as wintry weather remains south of us and it only takes a brief southerly flow to bring in frosts and snow this September and October. WeatherWatch.co.nz says September looks to be milder than average, but that still comes at a higher than usual risk of a snow storm or a frost event. The higher than usual risk is due to the stormier than usual weather circling over the Southern Ocean just to our south in recent weeks – and in the weeks to come.
We have the latest weather trends as we go into Spring 2024…
“NEUTRAL / LEANING LA NINA”


As we’ve seen in previous years, even if La Niña is declared it doesn’t always affect NZ’s weather. NIWA has a surprising lack of open public historical data (they have commercialised access to historical data which means it’s difficult – or impossible – for NZers to understand what truly happens to our weather patterns over the decades). La Niña is widely considered to bring more rain to NZ… but two of the last three La Niña events brought widespread drought/dry (in fact drought was worse during two prior La Niña events than this year’s El Niño… despite El Niño being considered to be a drought maker for NZ).
In a nutshell: We can’t always draw lines between what is happening in the tropics and the weather here in NZ. There is a lot NZers don’t understand about our climate and weather history because historical data is not compete or publicly viewable in this country. The NZ Government has it’s third official review underway about Niwa/MetService’s commercial operations (the review was technically completed back in summer but the results have not been released by the current Government). It’s worth noting that the last official weather Niwa/MetService review (2016) was shelved and entirely ignored by the prior Government. That review said NZ had some of the most inaccessible historical weather data on earth. Not having a clear understanding of NZ’s weather history makes it much harder to forecast long range.
AIR PRESSURE


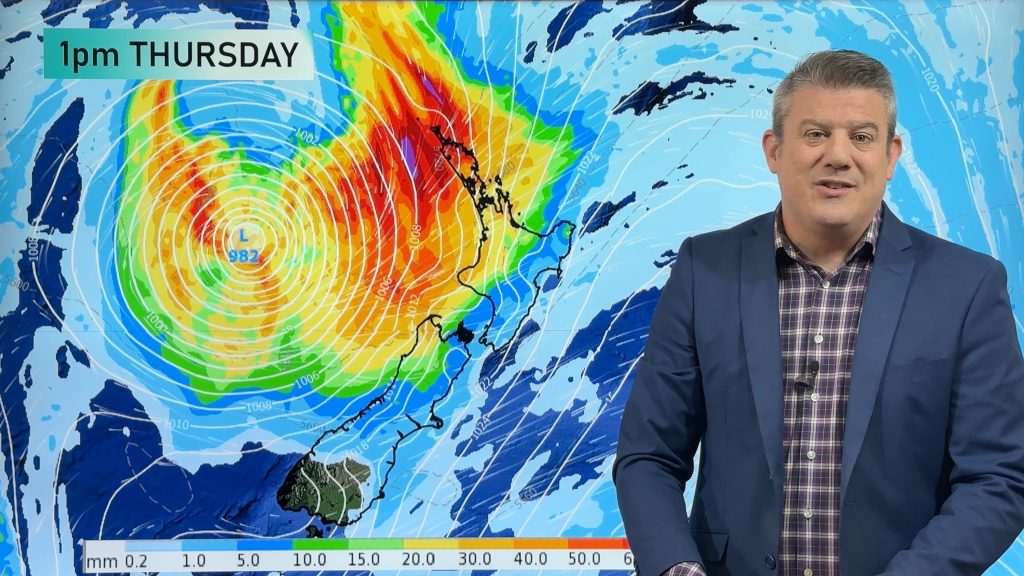
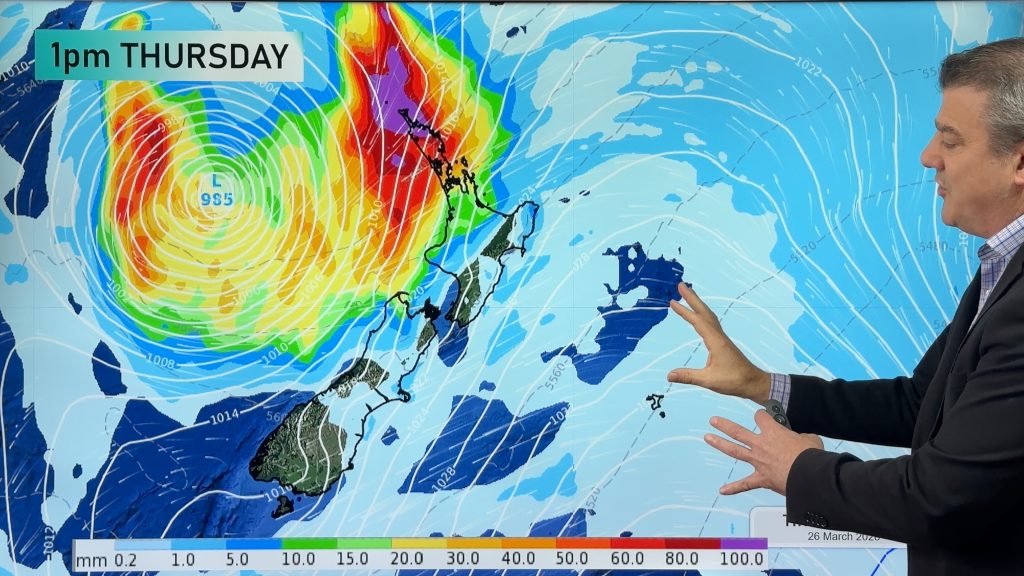
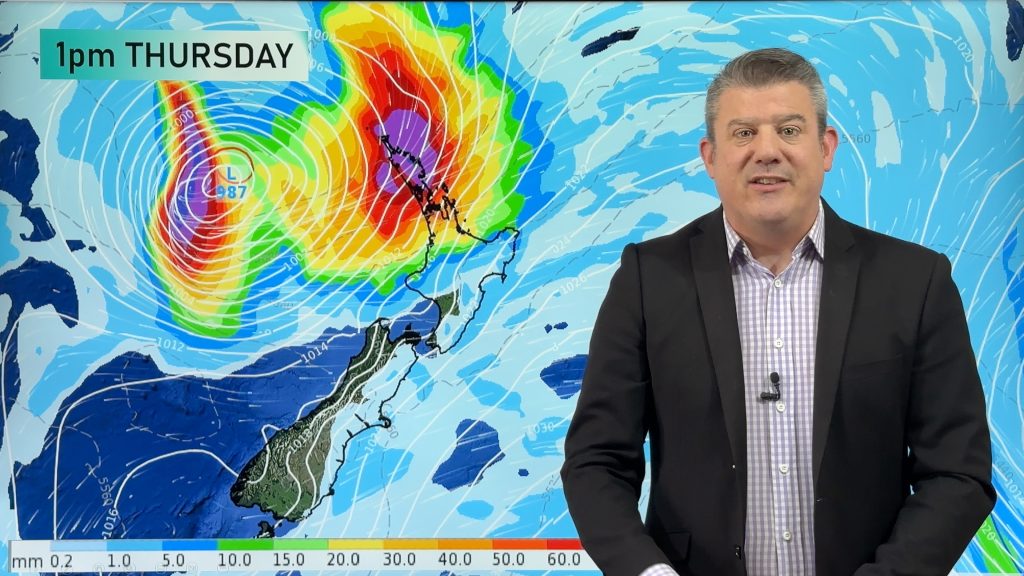
HALF MONTH RAIN FORECAST…
Areas in white show areas most at risk of rainfall above 100mm
– Maps powered by Weatherzone


The green and blue areas around Canterbury and Hawke’s Bay are at the lowest end of the scale.
This is just a general estimate, localised downpours may see some areas going higher.
MARINE


As always drill down deeper with your hyper-local, hourly, 10 day forecasts at WeatherWatch.co.nz, RuralWeather.co.nz – or download our Free WeatherWatch App.
Comments
Before you add a new comment, take note this story was published on 2 Sep 2024.
Latest Video
Subtropical storm moving in, gales and some heavy rain, especially Thu/Fri
Heavy rain and gale winds will slowly move down the country over the next 24 to 36 hours a subtropical…
Related Articles
Subtropical storm moving in, gales and some heavy rain, especially Thu/Fri
Heavy rain and gale winds will slowly move down the country over the next 24 to 36 hours a subtropical…
Tropical storm to bring severe weather to NZ, gales & heavy rain
A tropical cyclone is today leaving the tropics and will grow into a larger storm system for a time in…
Tropical low to bring wind & rain this week
A low exiting the tropics near New Caledonia this week will grow larger in the Tasman Sea and finally bring…


Add new comment