ClimateWatch: How January (and the rest of summer) is shaping up in NZ (+10 Maps)
2/01/2022 6:00am

> From the WeatherWatch archives
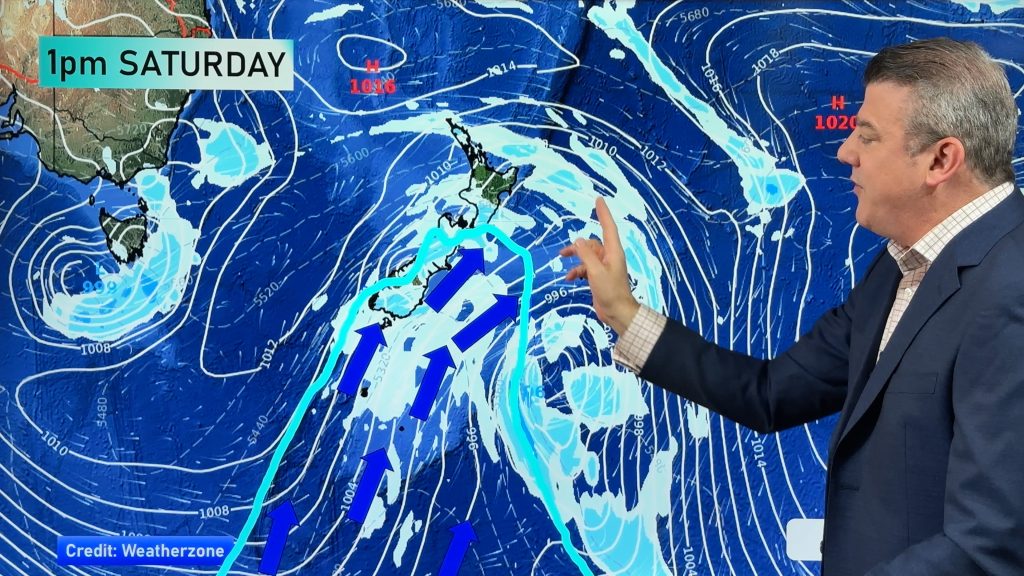
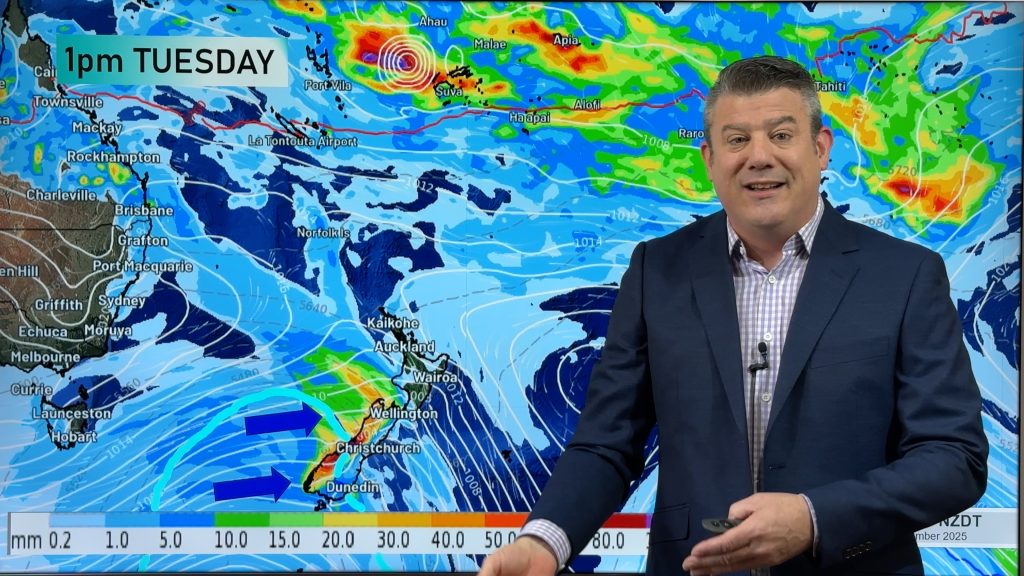
La Nina remains with us, but only just. The warmer than average sea conditions north of NZ continue to produce big rainmakers in the tropics, in particular the Coral Sea area which can often see lows drifting south into the Tasman Sea.
Storms that form in the Coral Sea pose risks to Queensland, sometimes New South Wales, New Caledonia and sometimes New Zealand. So the fact there is heightened activity there across December and now into January and February too, means it’s an area for New Zealanders to monitor.
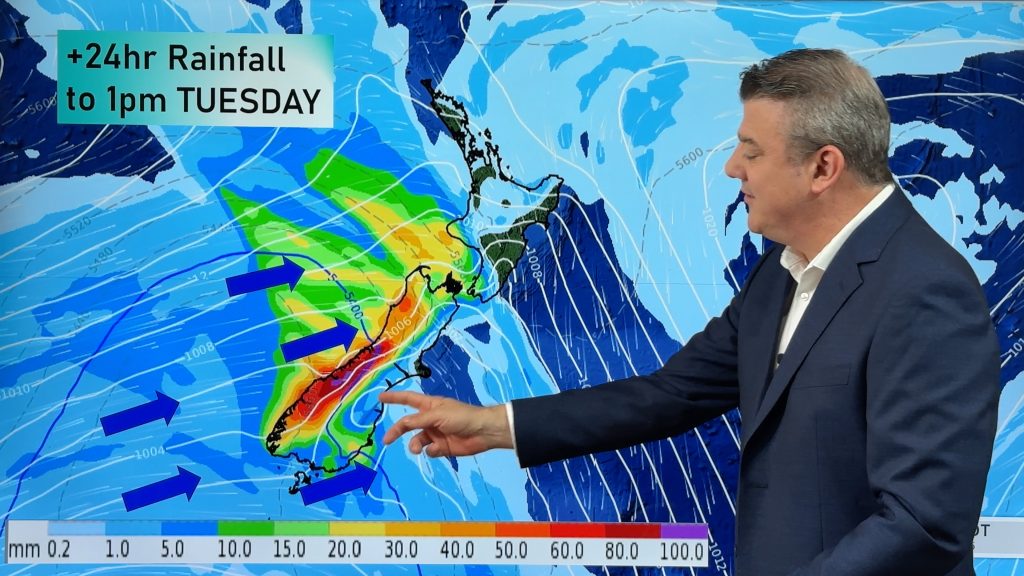
However, the high pressure zone coming out of the south of Australia and Southern Ocean area is quite consistent as it tracks from west to east. These highs act as an invisible brick wall, keeping those tropical lows in the tropics and bringing drier weather to NZ for holidaymakers. But each time the centre of a high passes over NZ and then departs to our east it gives an opportunity for one of these tropical lows to drop southwards. It all depends on if there is a ‘gap’ large enough between the departing high and the next incoming high to let a low pressure zone/rain maker drop southwards.
And that is really the focus of the next month or two ahead.
The maps below should help paint more detail for you.
For NZ’s most detailed hyper-local forecasts, please use RuralWeather.co.nz to drill down even deeper – powered by our partnership with IBM Watson.
*Please note, the ClimateWatch video below is our Summer Outlook, recorded Dec 1, 2021. Our next ClimateWatch video update will be on February 1st, 2022.

La Nina is measured at the equator and NZ is halfway from the equator to Antarctica – so we’re influenced by La Nina patterns but not always dominated by them (which is why NZ has had cooler weather lately too, especially in parts of the South Island).

HOW JANUARY IS SHAPING UP…


TEMPERATURES…

JANUARY, FEBRUARY, MARCH
Shows NZ leaning half a degree to 1 degree above normal. The opposite to what is forecast for New South Wales.

JANUARY ONLY
Most of NZ leans about 0.7C above normal. If you’re in the South Island and maybe thinking the daytime temps have been down, this may be true – but milder overnight conditions may also be leading to a warmer than usual January.
RAINFALL


JANUARY ONLY
As you can see the North Island is expected to get some rain, a combination of heavy afternoon downpours inland that drift, and also the chance of one of those tropical / sub tropical rainmakers moving through. Canterbury’s trend of leaning wetter continues on to some degree.

FEBRUARY ONLY
Looks like an even greater chance of La Nina rainmakers influencing the upper North Island, with a chance it could turn very wet (or have a big single rain event). The lower South Island leans drier than usual, likely influenced by more southern highs. These maps are powered by IBM Watson.
Comments
Before you add a new comment, take note this story was published on 2 Jan 2022.


Add new comment
David Hurlr on 1/01/2022 4:45am
Happy NY all at WW. Appreciate today’s post as I fret for my tomatoes at home as I get sand blasted at Port Waikato.
Reply