Big low one to watch this weekend, some areas of heavy rain (+New Maps)
4/10/2017 9:41pm

> From the WeatherWatch archives
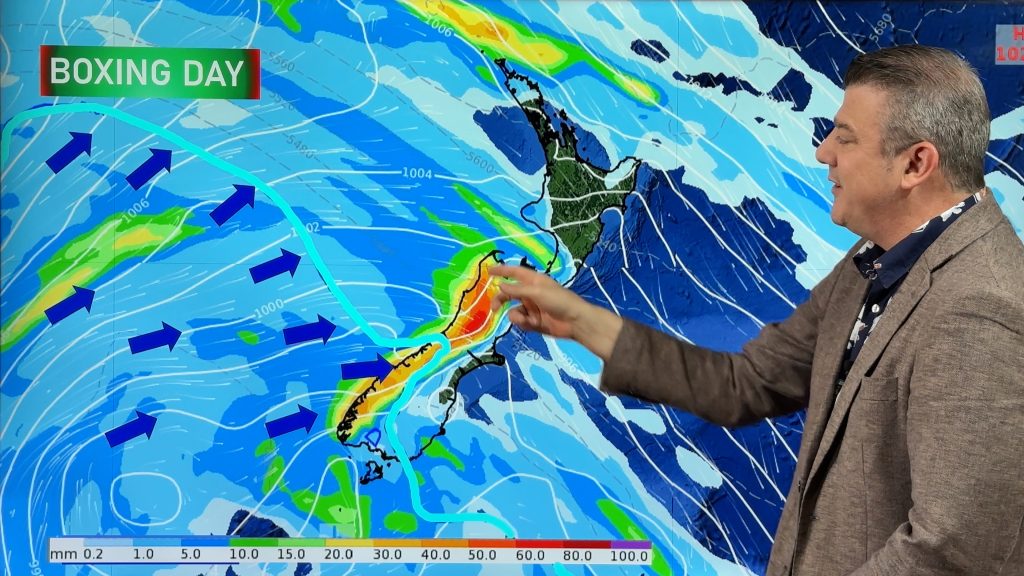
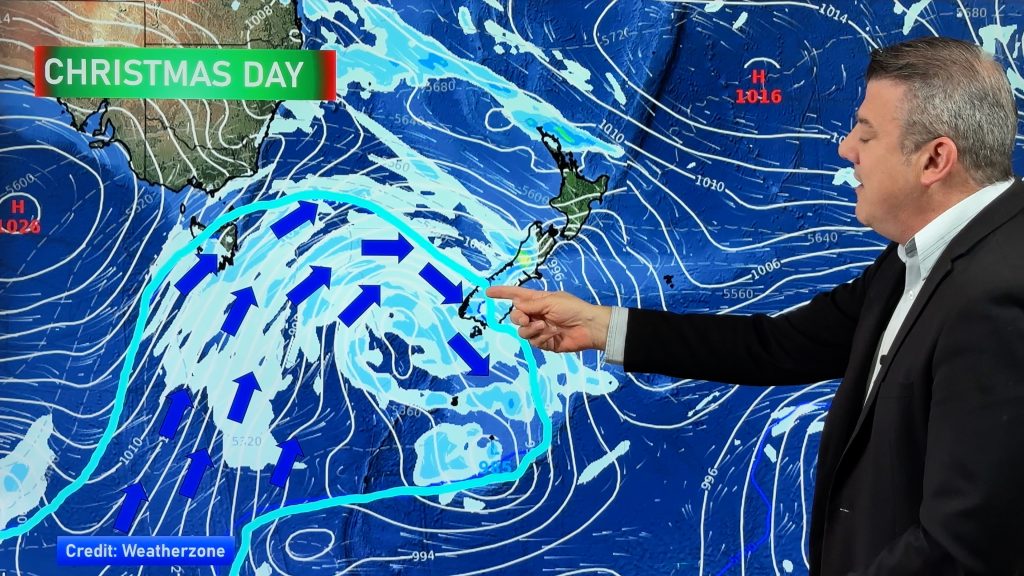
!NEW FEATURE/MAPS — A large low pressure system is coming in to New Zealand this weekend and, sorry, there is more rain.
The low will peak in intensity on Saturday then weaken gradually over Sunday and Monday and early Tuesday as it tracks across the country, mostly over the North Island and upper South Island.
A blocking high to the east of New Zealand will both slow the rain clouds down and also feed the rain clouds with sub-tropical air.
There is a chance this low will have more bark than bite – it looks sizeable but it is weakening as it comes in. However, some localised areas may see enough rain to cause slips or flooding.
Here’s the latest from our new official partners at The Weather Company/IBM
- A developing low which is now affecting Tasmania will be deepening over the Tasman Sea for the next couple of days.
- It is expected to start affecting western and northern coastal areas of South Island on Saturday.
- On Sunday, widespread areas of rain, showers and drizzle are forecast over the country and this rain pattern seems remain for over 36 hours.
- While wet weather is likely to be widespread, total accumulations may not be too extreme for many places.
- Heaviest rain looks likely around Golden Bay/Nelson Ranges area – with over 100mm of precipitation possible by Monday.
- Mt Taranaki and western Bay of Plenty are also candidates for bigger rainfall totals, perhaps 40 to 80mm.
- Strong winds and slips are possible around the South Island ranges/mountains.


*Apologies for the blurriness of the key – these maps are new for us to trial and we’re going to make improvements to them later this year.
– If you can’t read the figures in the key simply note that the colours at the top of the chart in blue, yellow, green and orange indicate rainfall totals of just 2 to 15mms. Reds, blacks and purple/pink in the middle are around 25 to 60mm and the blues, pale blues and white at the bottom end of the scale are between 70 and 200mm.
– Data/Maps by The Weather Company/IBM
– WeatherWatch.co.nz
Comments
Before you add a new comment, take note this story was published on 4 Oct 2017.


Add new comment